Examples
Delve allows the user to create plots and log records in various formats.
Plotting
Delve allows plotting results every epoch using save_to="csvplot", which will create automated plots from the metrics
recorded in the stats argument. The plots depict the layers generally in order of the forward pass.
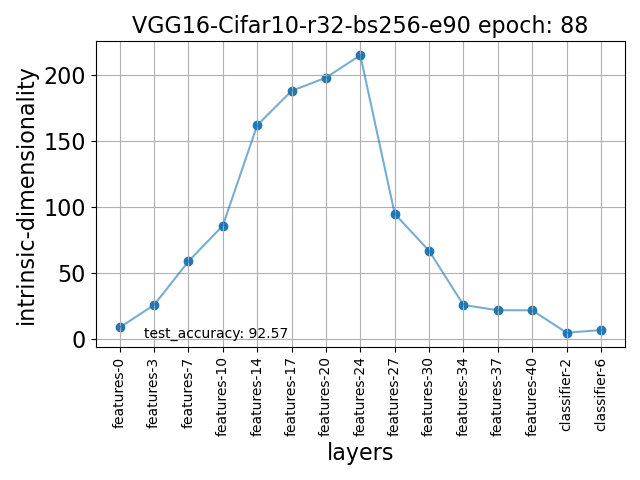
Automatically generated plot of intrinsic dimensionality computed on the training set of Cifar10 on VGG16 at the 88th epoch of a 90 epoch of training.
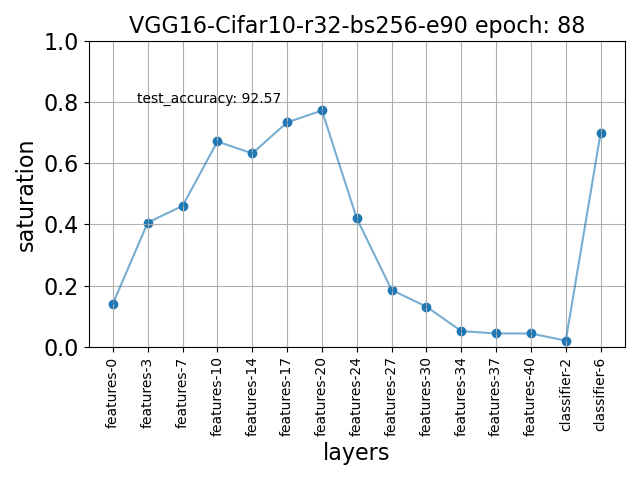
Automatically generated plot of saturation computed on the training set of Cifar10 on VGG16 at the 88th epoch of a 90 epoch training.
Logging
Delve logs results with the logging package and shows progress with tqdm.
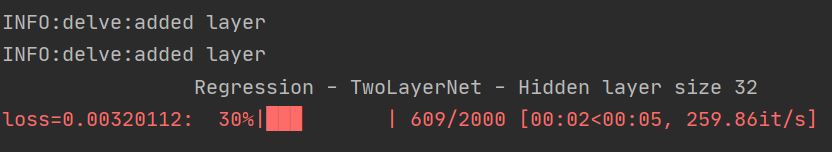
A simple example generated from a two-layer network trained on randomly generated data is provided in sphx_glr_gallery.